 jevieDocs
Download
Answers
Cards and generated interfaces
Ask for a tracker, a calculator, a comparison or a chart and use it right in the answer, then change it in words or keep it.
FreeMacWindowsPhone
Choose an example to copy it, then try it in Jevie.
Start with something usefulUse itMore ways an answer can workHow it worksLimitsWhere it's kept
Start with something useful
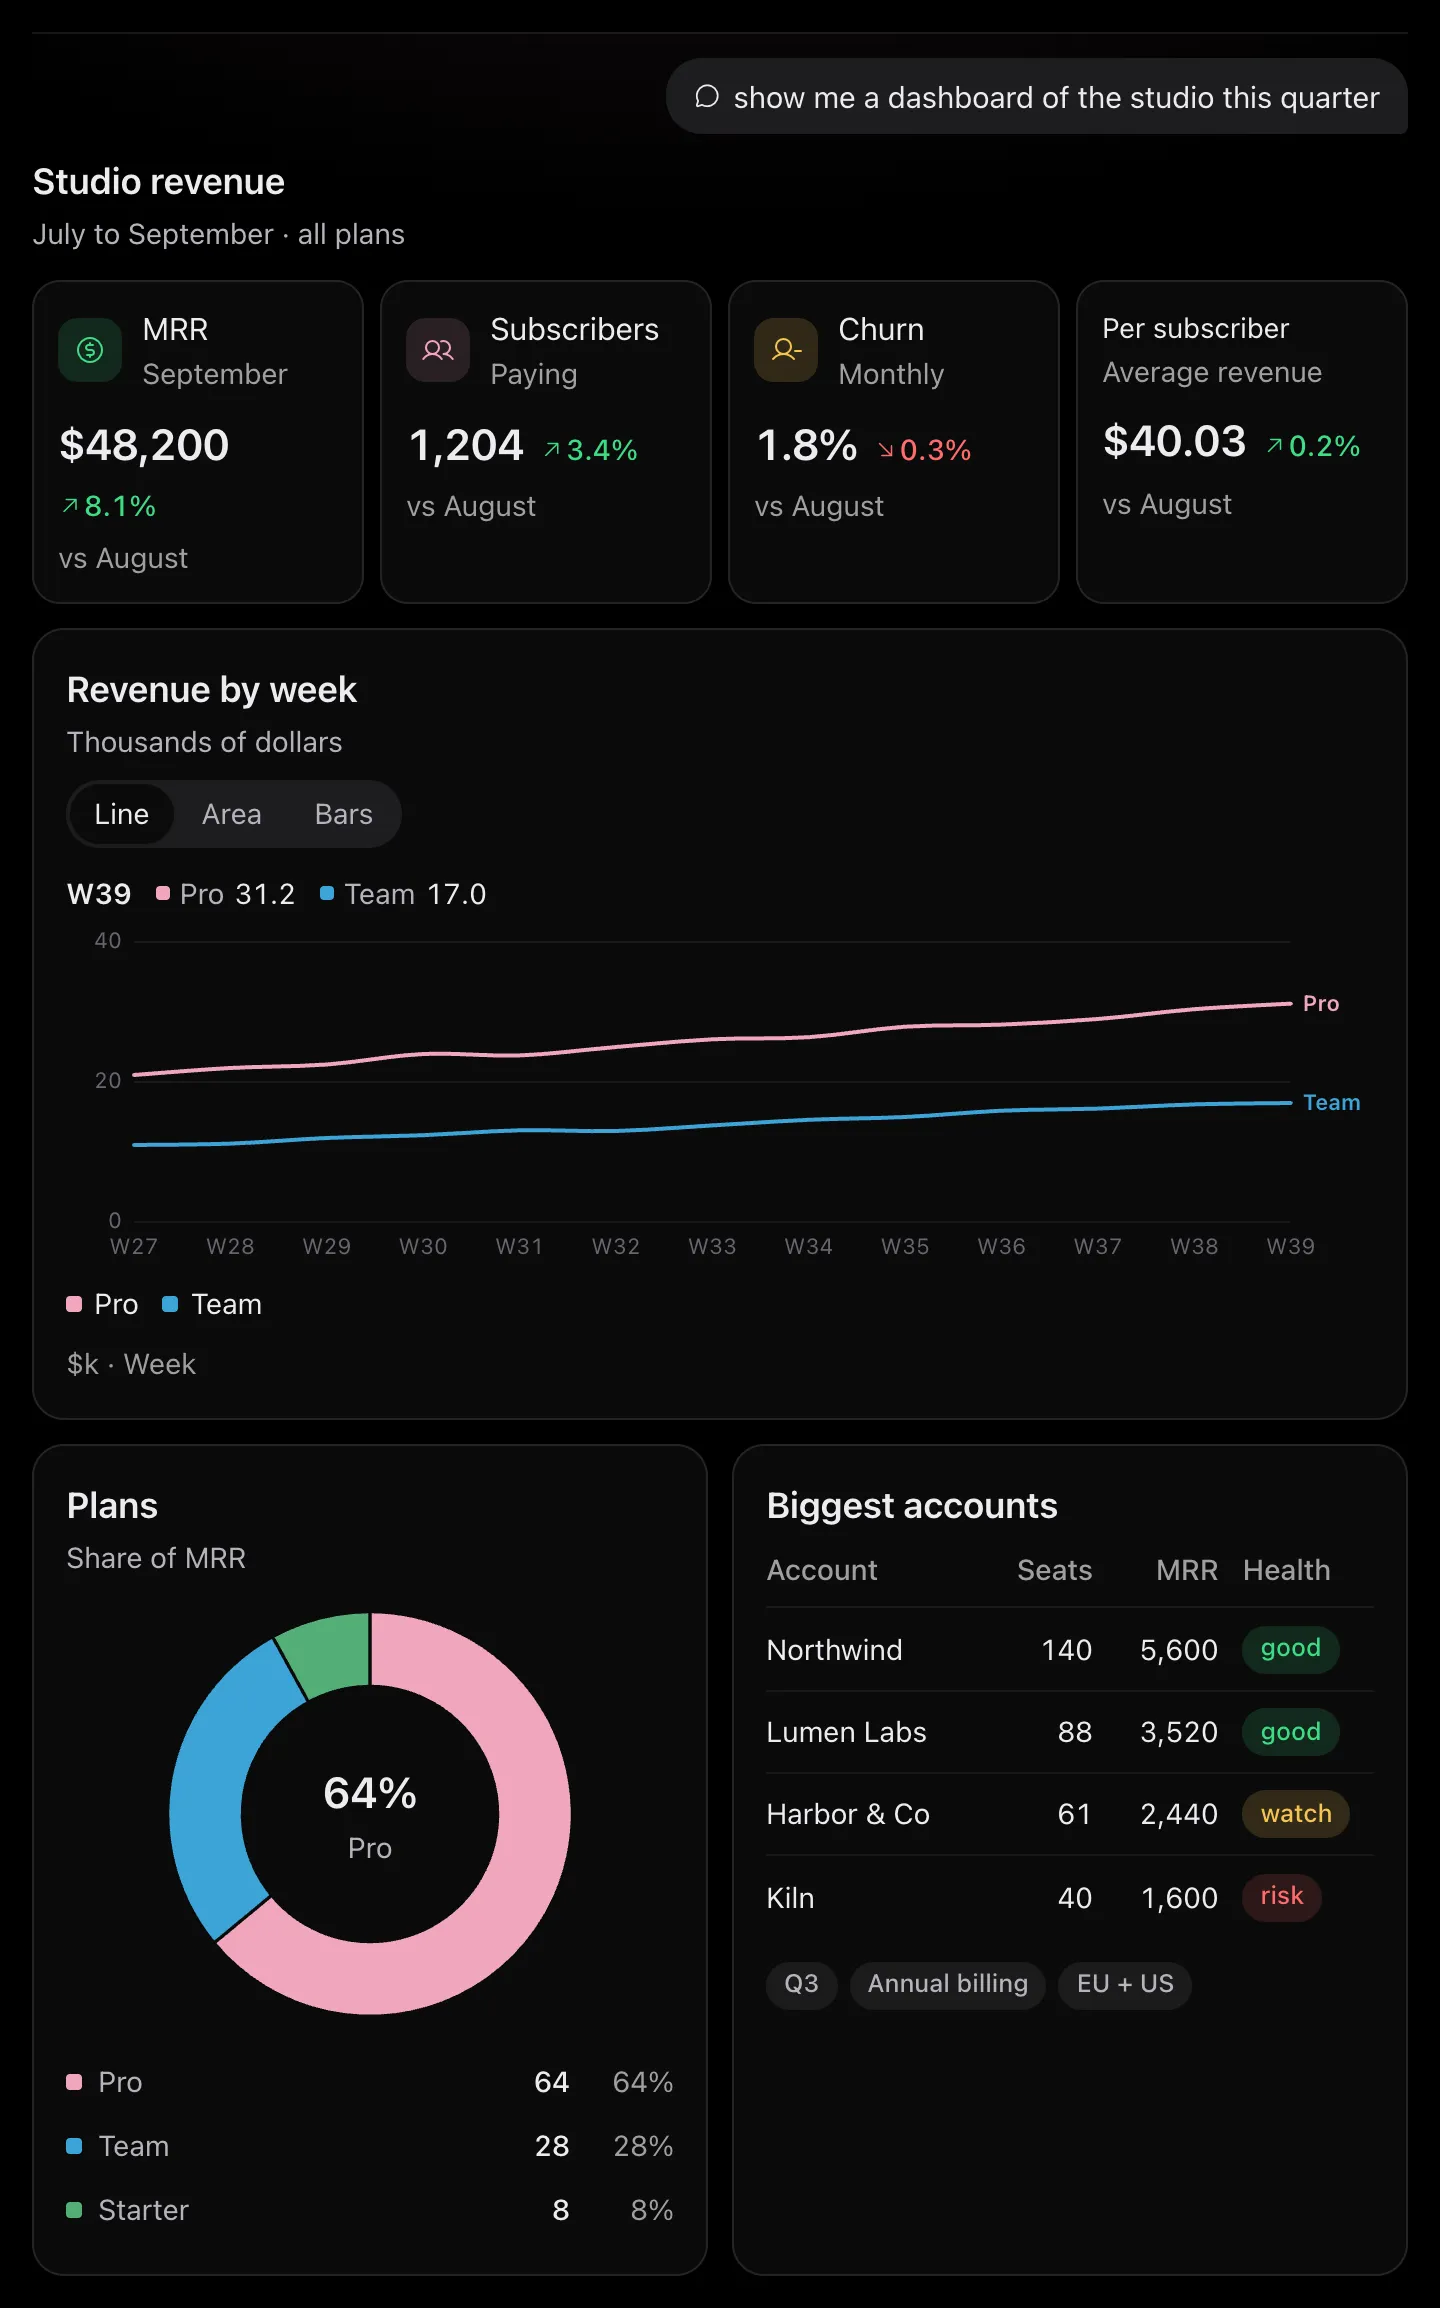
show me a dashboard of the studio this quarter
Drawn by Jevie's own renderer with made-up data.
Say what you need and the answer comes with controls: a checklist to tick, a chart to inspect, a form to fill, a calculator to adjust. The pictures use sample data.
Use it
Build something
make me a coding interview prep tracker
A tracker whose checklist can become real to-dosbuild a tip calculator
Change the inputs, see the resultmonthly payment on a 300k mortgage at 6.5% for 30 years
emi for a 10 lakh loan at 9% for 5 years
The payment worked out on your Mac at once: in dollars a loan calculator to adjust, in rupees, euros or pounds the figures written out. With a down payment or a second rate, a model draws it insteadcompare the 5 best noise-canceling headphones under $300
Product cards from pages read on the webplan a 3-day itinerary for Tokyo
A plan you refine with your next sentencebuild a snake game
A mini app running in the answer
Change it and keep it
add a pie chart of the statuses
remove the table
Changed in place, your values keptkeep this as sprint board
open sprint board
Saved by name, reopened later; a change said to it starts from the file as it is now, so an edit made there since is keptkeep it in my notes
email it to me
Its rows taken where you say- The link button on a mini appA link anyone can open for 30 days, in their own browser, with no network; Stop sharing ends it
- Share to Team under an appIt plays in that space for everyone on your team
copy the answer
Text, tables, places and sources
Charts
candlestick chart of Apple stock this week
line chart of AAPL vs MSFT this year
Live pricestreemap of my spending this year
Your receipts, by where the money wentline chart of weather in dallas this week
The forecast, rain as barsa waterfall chart from August revenue 44,600: new buyers +6,200, refunds −1,700
From numbers you givechart my spending by category: rent 1200, food 400, travel 250, fun 150
graph my weight: jan 82, feb 81, mar 79.5
The figures you give drawn at once, never looked for in your receipts or opened in another appa study schedule for my exams next week
a 12 week marathon training schedule
Tasks laid out over the days, to keep in your notes if you likeopenui gallery
what genui components do we have
Every part and chart on sample data
More ways an answer can work
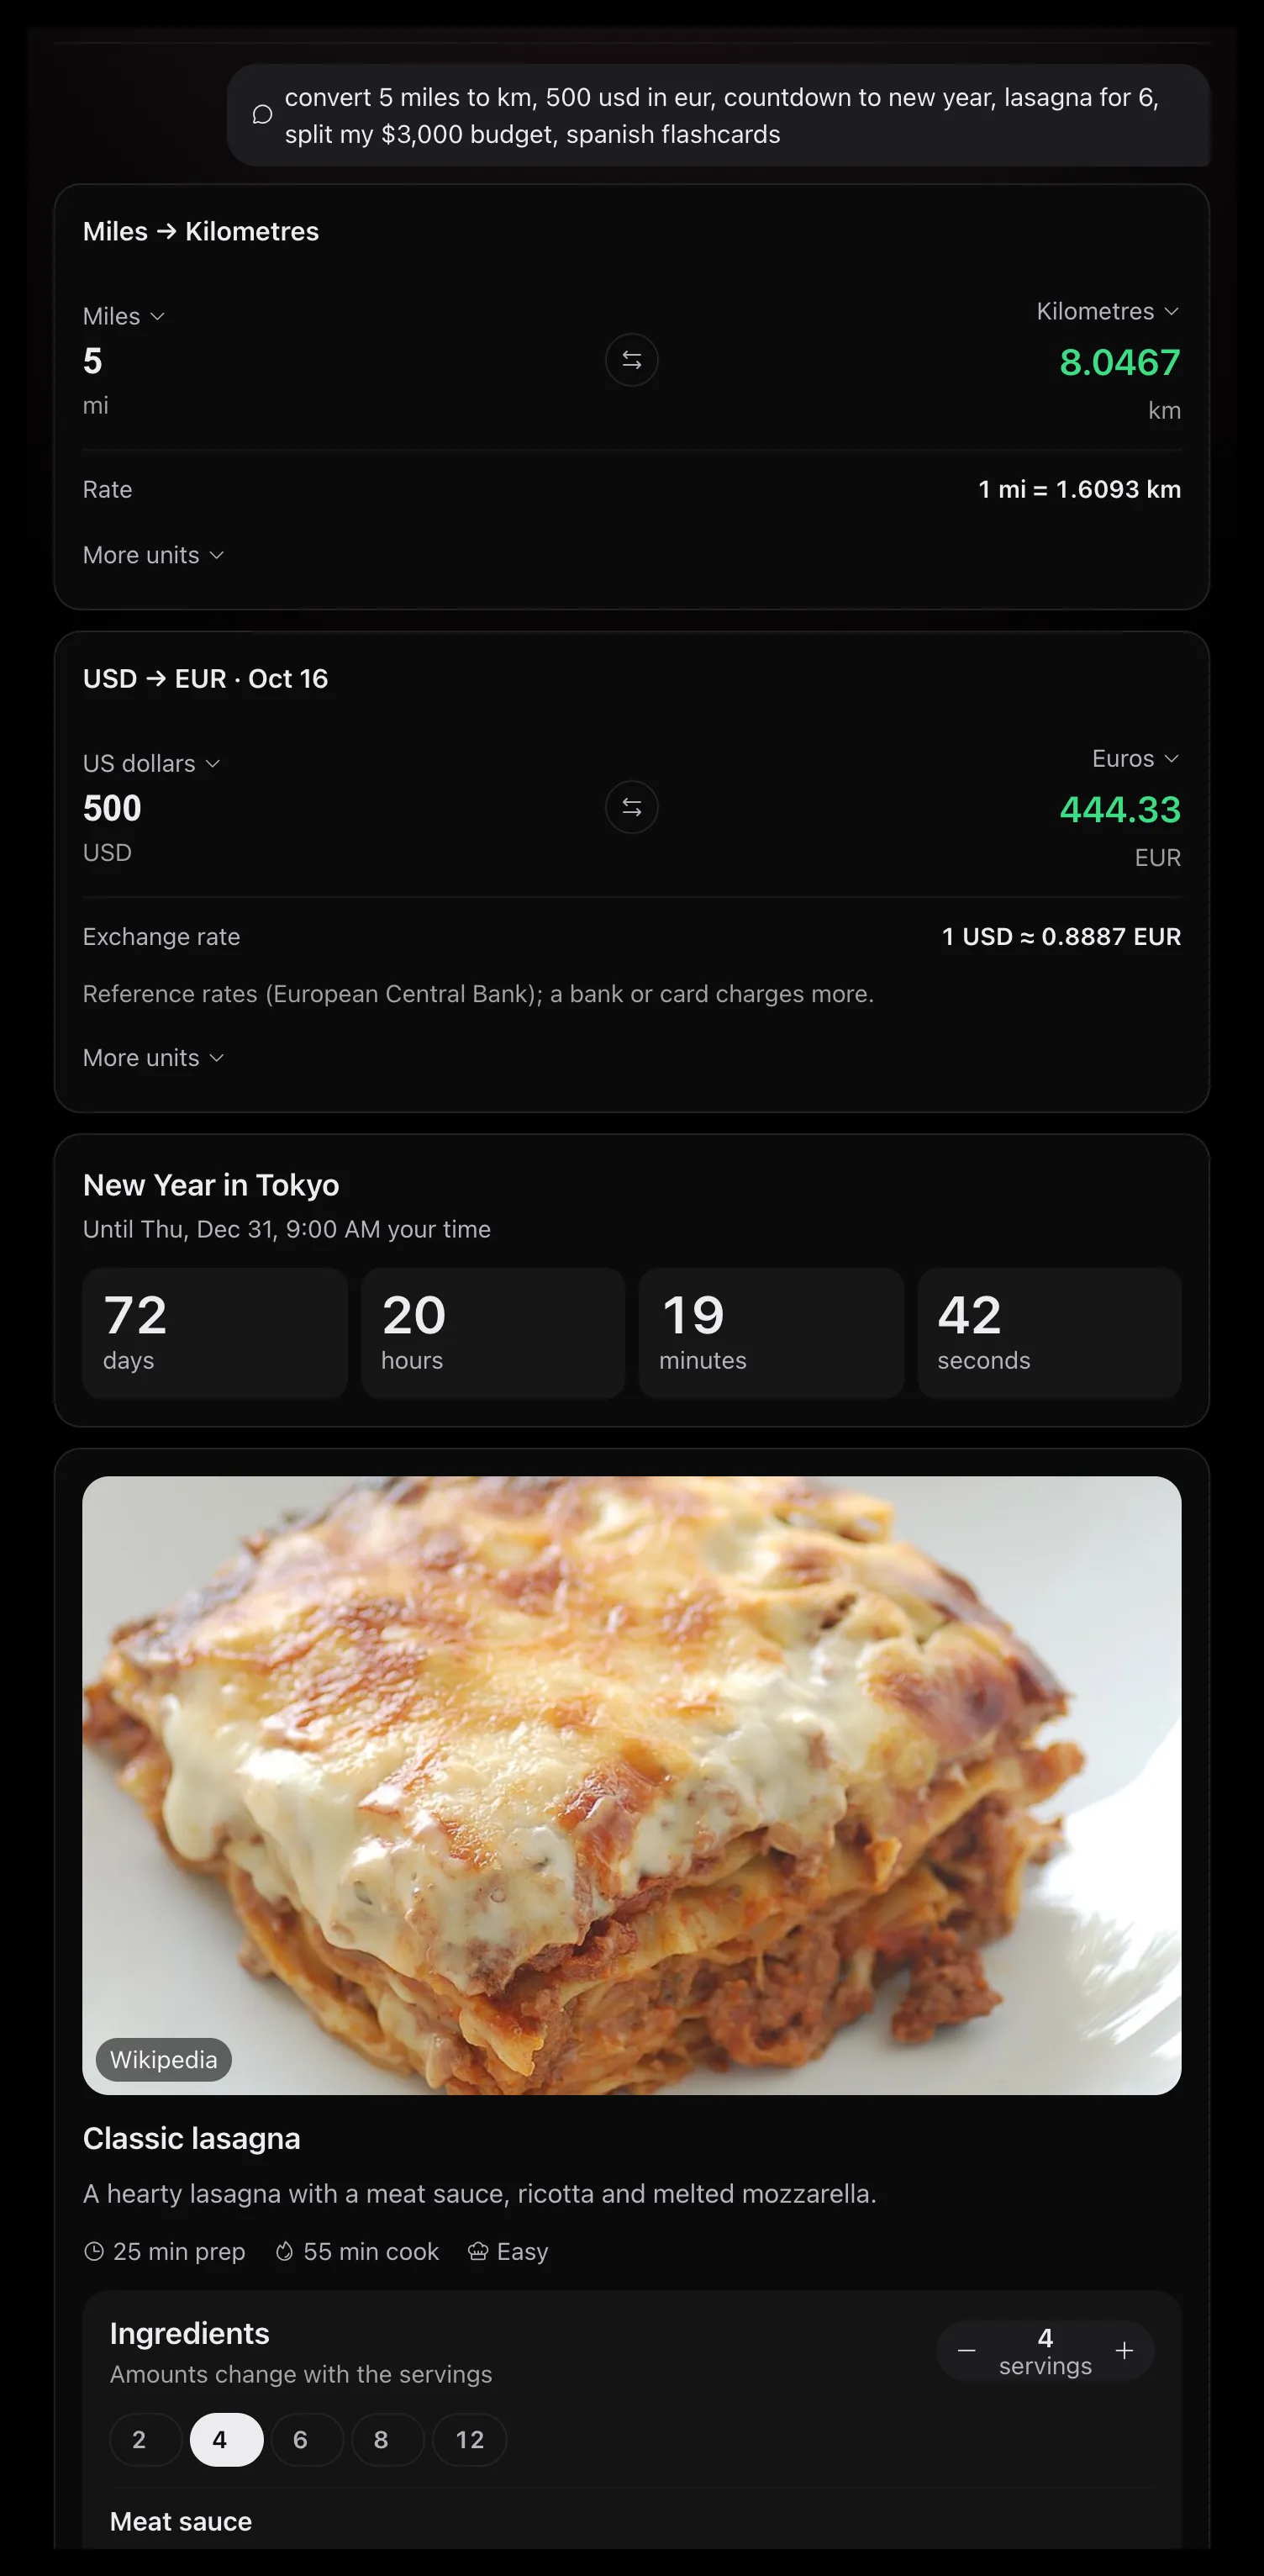
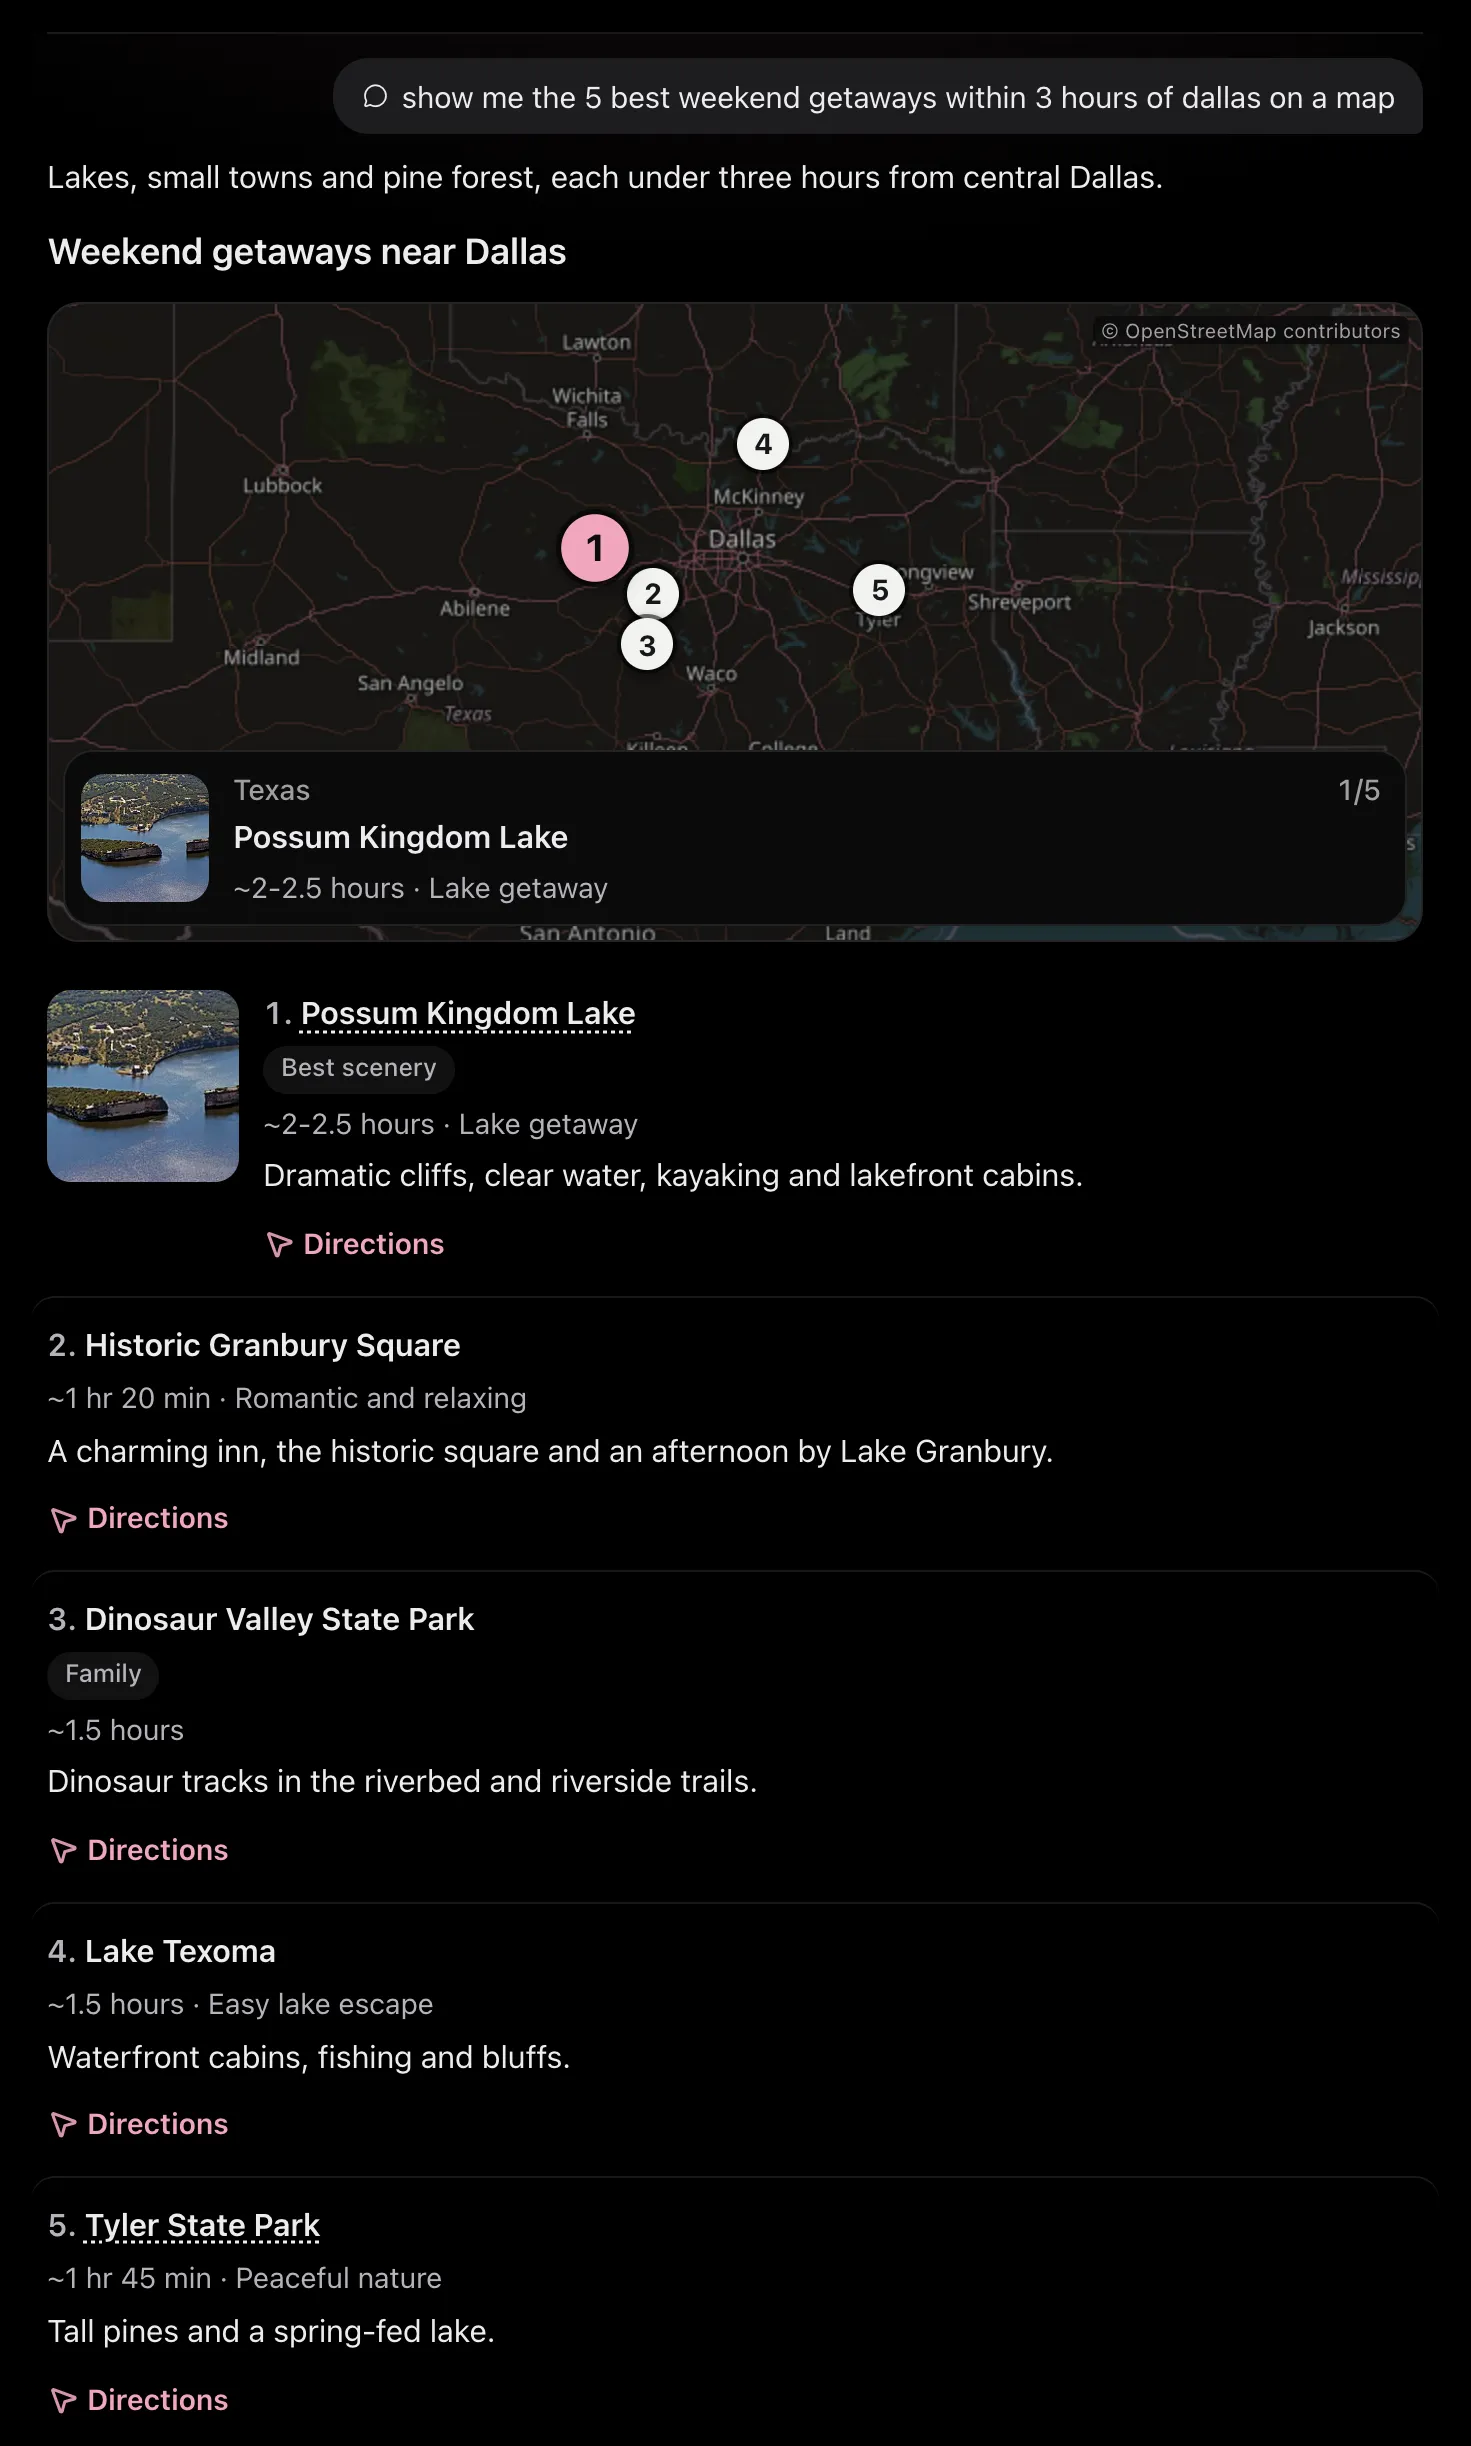
Drawn by Jevie's own renderer with made-up data.
Quizzes, flashcards, recipes, converters, maps and news all come back as something to use, not just read.
quiz me on world capitals
make flashcards for 8 spanish words for food
Answer and see your scorelasagna recipe for 6
Change servings, tick ingredients, run a step's timershow me the 5 best weekend getaways within 3 hours of Dallas on a map
Pins, cards and directionsconvert 5 miles to km
500 usd in eur
A converter at today's rates
How it works
You never pick a component: describe what you want and the right one is drawn, on the Mac, the phone and the web alike. Every total, change and percentage on a chart is worked out from the figures themselves, never made up, and the line under it says where they came from.
A written answer has the same shape: the answer in one line first, then its reasons each under a small title, steps with their keys drawn as keys, short facts (a symbol, a unit, a date) as tiles, and a bottom line when you asked which to choose. A question one sentence answers gets that sentence alone. On the Mac and the phone it arrives in that shape from its first words: the answer line, its key phrase in your accent, comes first, and each reason, step or fact takes its place as it is written; nothing is drawn again when it finishes.
Each reason's title can carry a small coloured icon for what it is about (a pin for where, a heart for health); when no icon fits, there is none.
Up to three next-step buttons follow an answer, such as adding a recipe's ingredients to your grocery list.
An answer in the palette is a conversation, as Google's AI answer is: your question sits over it and the field says Ask a follow-up. What you type there goes on from the answer, in the same session with your default agent (Claude, Codex or whichever answers for you), which is given the whole thread. The session lasts while the palette is open; closing it or switching to voice (⌘⌘) ends it, and a sentence typed away from the answer starts a new one.
Limits
- A chart draws the figures it is given; it does not connect to your analytics by itself.
- A shared app link needs Jevie Cloud. A Mac with keys of its own gets a separate Jevie Cloud account the first time it shares: it holds the links and never answers with a model, so your own keys still do the thinking. The link stops working after 30 days.
- A web result is not proof a price or opening time is still current.
- Stock prices, forecasts and web pages come from public sources; spending charts read your Gmail receipts.
Where it's kept
Kept interfaces are readable files in ~/.jevie/self/apps/, with version history; your own components in ~/.jevie/self/components/.
In Jevie, help genui
answers from this page as you type.
Related
Updated 6 November 2026 · Something wrong or missing? Tell us